The Job Utilization Dashboard provides an overview of job usage for your account through time. It can help you understand and analyze your job performance: by analyzing the information provided in the Job Utilization Dashboard, you can gain valuable insights into the performance of your jobs and make informed decisions to optimize efficiency, troubleshoot issues, and improve overall system performance. These statistics began being collected in May of 2024 for all existing accounts and departments.
Where can I find Job Utilization dashboard?
An overview of the job utilization for your account is found on your Web Console:
-
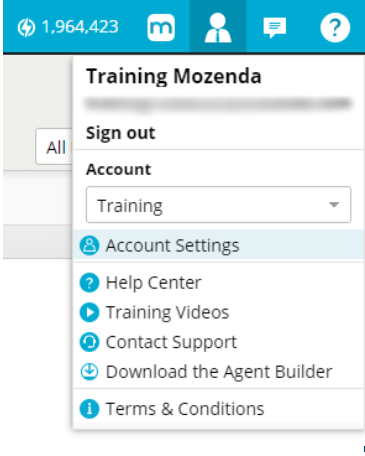
Select the User icon

-
Select Account Settings.
-
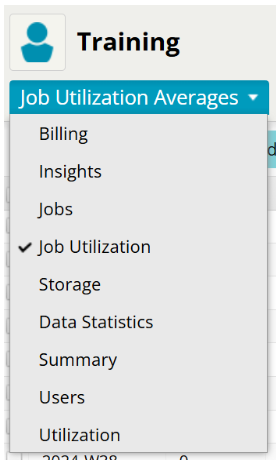
Click the Summary drop-down and select Job Utilization.
-
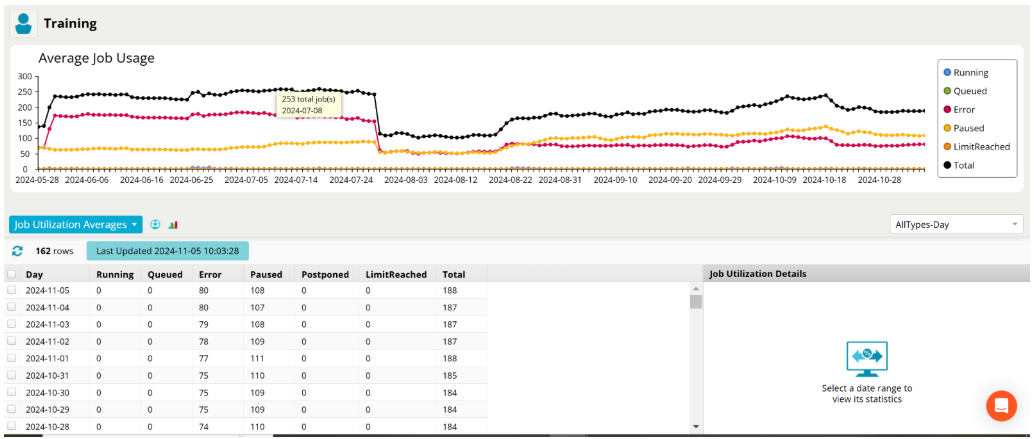
Job Utilization Averages dashboard will be loaded on your web console.
How is the Job Utilization dashboard organized?
Job Utilization Averages is organized in 3 sections:
-
Average Job Usage chart: shows through a graph the distribution of jobs for the account. To see more clearly the distribution of jobs in time for only a certain job status, you can select to remove or leave the graph of each of the status jobs through the table on the right. Also, you can select the Hide Chart option to remove the chart from the window.

-
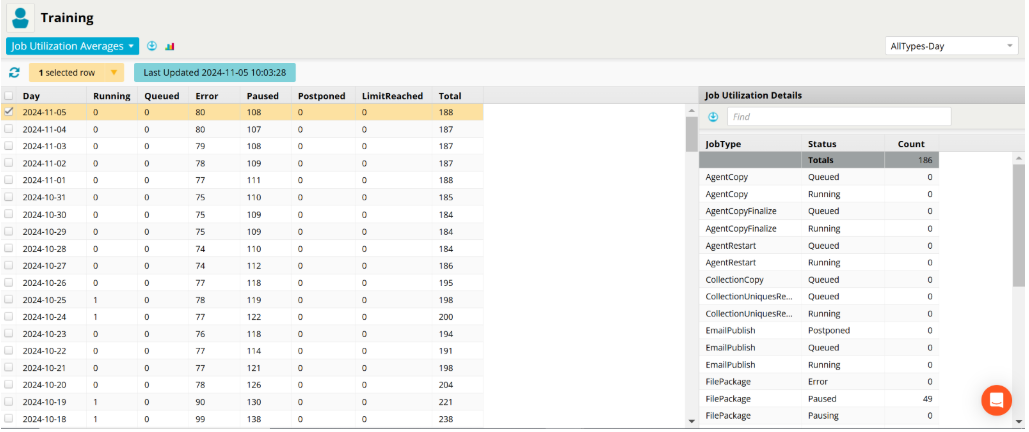
Average Job Usage statistics: is a table that shows for each day, hour, week or month on average how many jobs were Running, Queued, Error, Paused, Postponed, or LimitReached on your account.
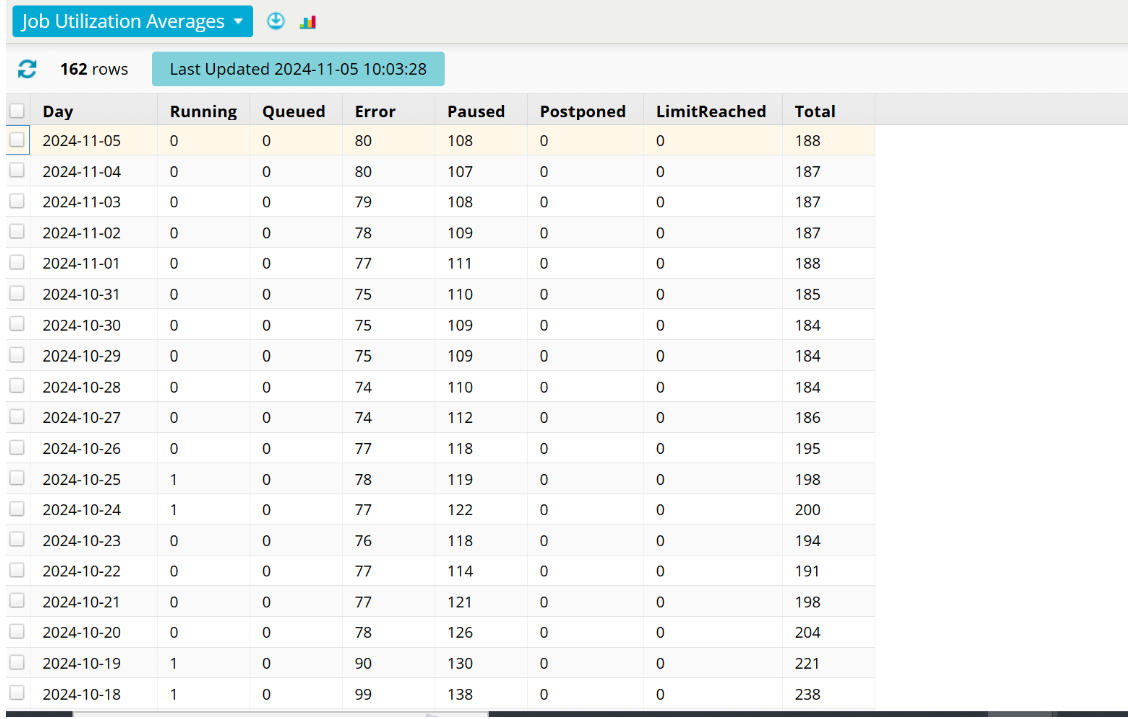
-
Job Utilization Details: After selecting a certain record on Average Job Usage table, the window on the right under this name is loaded, which displays a table with further information on the specific number of jobs from the Total that are part of a specific JobType and Status for that record.
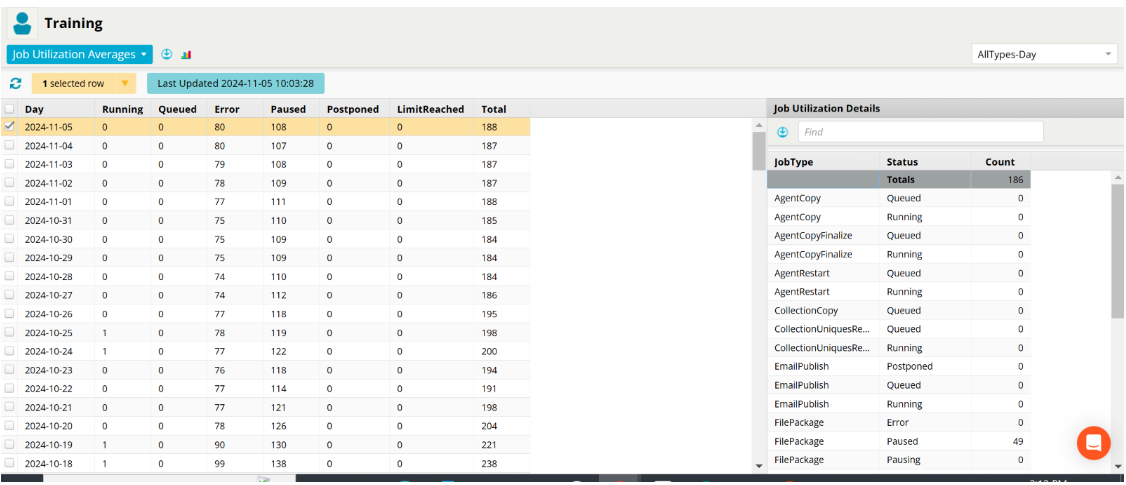
Can I change the distinct time groupings of job utilization statistics?
See a breakdown by day, hour, month, and week by selecting the drop-down in the far right-hand corner of the screen. This allows you to select different views for your job utilization statistics. There are two general types of views with four distinct time groupings to select:
- AllTypes: these views include all types of jobs executed on your account. You can see the statistics here by day, hour, month, and week selecting each one.
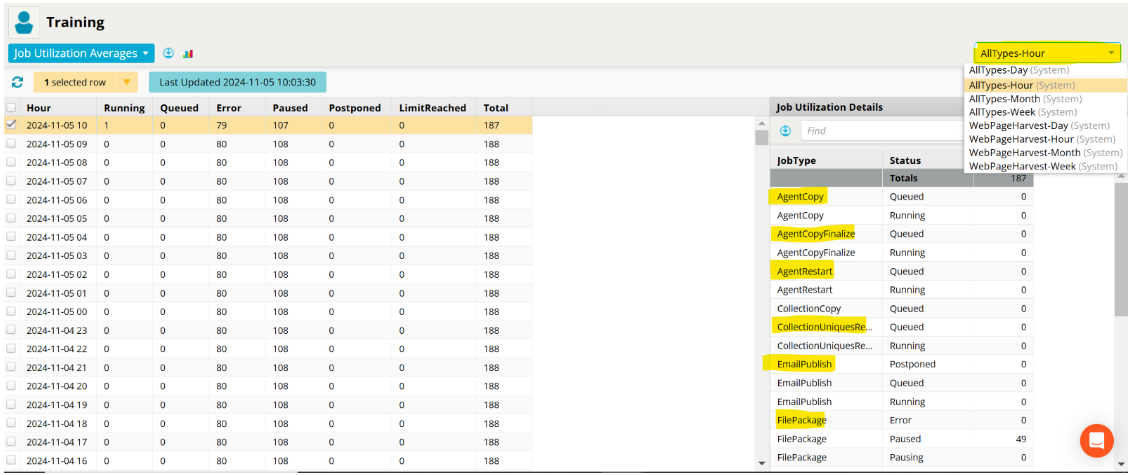
- WebPageHarvest: these views include only WebPageHarvest job type statistics for your account. You can see the statistics here by day, hour, month, and week selecting each one.
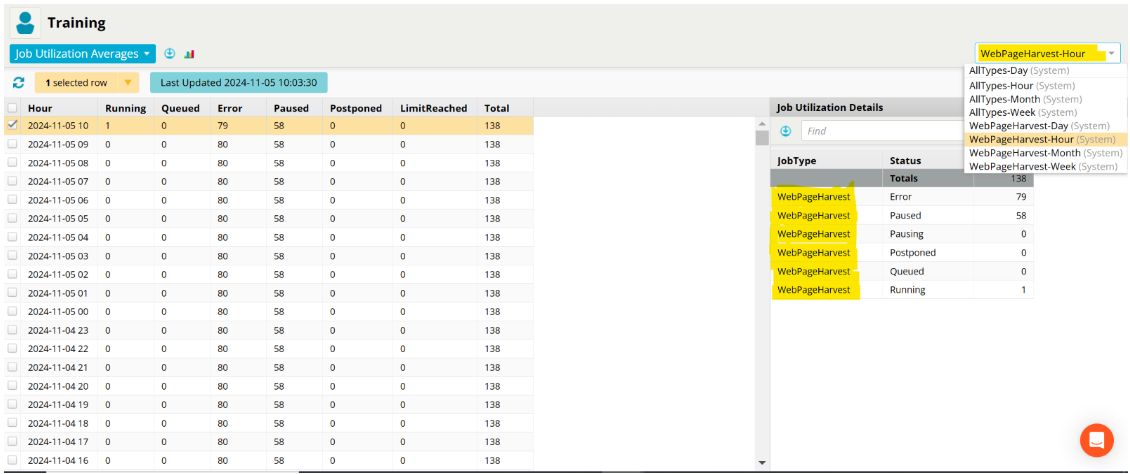
How to download my Job Utilization Averages statistics?
Select ![]() to download statistics for a specific view:
to download statistics for a specific view:
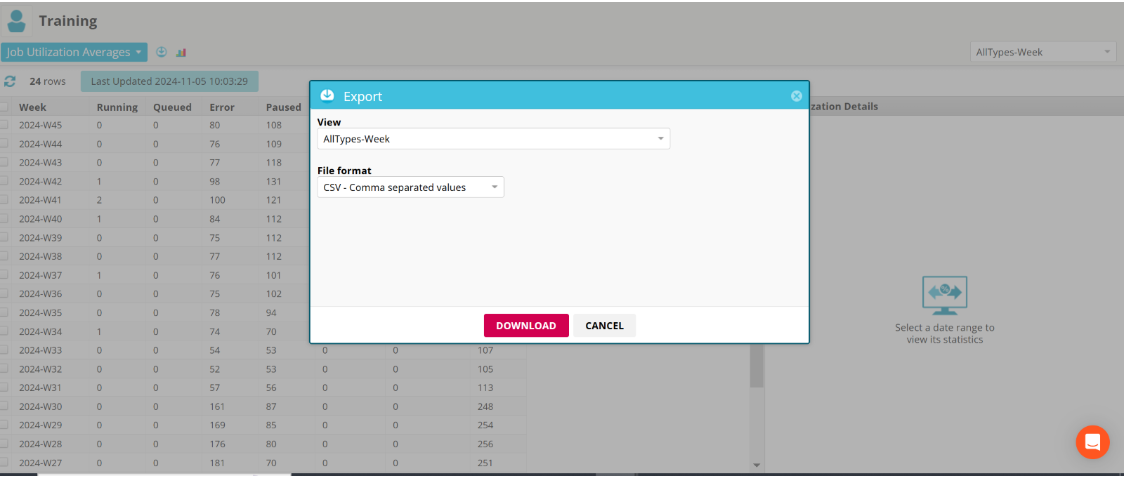
- Hour, Day, Month or Week is a field that changes depending on the view type you are accessing.
- Running refers to the jobs which are currently running on your account.
- Queued refers to the jobs that are queued waiting to start the running process.
- Error refers to the jobs that have been errored out.
- Paused refers to the jobs that are paused manually or automatically via API usage on your account.
- Postponed refers to the jobs that are retrying to rerun on your account.
- LimitReached refers to the jobs that have reached the limitation of processing credits.
- Total shows the total number of jobs for that specific hour, day, week, or month depending on the view you are accessing
- JobType refers to the type of job that has been executed.
- Status refers to the status of the job and takes values as Queued, Running, Postponed, Error, Pausing or Paused.
- Count refers to the specific number of each JobType with a specific Status.